Network Effect
Human Life on the Internet
The Internet is said to show our common humanity. Through its data, it is said to provide a kind of omniscience, and through its social networks, a deeper sense of connection. For those without access, it holds the promise of a better life. For those of us who use it a lot, its power to affect our lives is clear — but what is the nature of that effect? How does it change our behavior? The way we see others? The way we see ourselves?
Like the Internet itself, the project is effectively endless, containing 10,000 video clips, 10,000 spoken sentences, news, tweets, charts, graphs, lists, and millions of individual data points, all presented in a classically-designed data visualization environment. To see and hear it all would take hours, but the viewing window is limited to around seven minutes (according to the average life expectancy in the viewer’s country), which induces a state of anxiety, triggers a fear of missing out, and totally frustrates any attempt at completeness.
The videos activate our voyeurism, the sound recordings tempt us with secrets, and the data promises a kind of omniscience, but all of it is a mirage — there is no one here to watch, there is no secret to find, and the data, which seems to be so important, is actually absurd. In this sense, the project mirrors the experience of browsing the web — full of tantalizing potential, but ultimately empty of life. We do not go away happier, more nourished, and wiser, but ever more anxious, distracted, and numb. We hope to find ourselves, but instead we forget who we are, falling into an opium haze of addiction with every click and tap.
The Internet is a miraculous tool, but all too often, it affects us like a drug. Many of its popular apps, news websites, and social networks have been carefully designed to addict and distract, so they can harvest human attention like the natural resource it is. “Keep searching and you will discover,” these services seem to proclaim, but the deepest truths cannot be found by searching — and you will not find them in data, in videos, or in images of other people’s lives.
We need time and space and silence to remember who we are, who we once were, and who we can become. There is a way, and every one of us contains the potential to find it.
Jonathan Harris + Greg Hochmuth
August 2015
Jonathan Harris is an artist and computer scientist, known for his work with data poetics and storytelling. He is the creator of classic interactive projects like We Feel Fine, 10x10, The Whale Hunt, and I Love Your Work. A Webby winner, Fabrica fellow, Hemera fellow, and World Economic Forum Young Global Leader, his TED talks have been viewed millions of times, and his artwork is in the permanent collection of MoMA.

Greg Hochmuth is an artist and engineer specializing in data science. He studied computer science and design at Stanford University, and then worked as a product manager, engineer, and data analyst at Google, Instagram, and Facebook. Greg also operates DADA, an agency focused on data engineering and insights.
Network Effect draws data from a variety of sources.
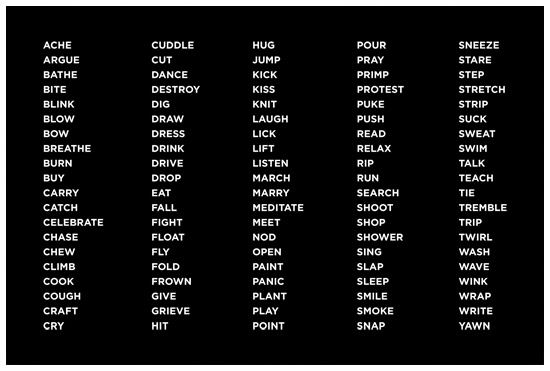
We began by choosing a list of 100 canonical human behaviors — basically, a long list of verbs (eat, sleep, stare, etc.). We tried to choose behaviors that were corporeal instead of cerebral (e.g. pointing not thinking) and that were temporally universal (i.e. not dependent on any particular moment in history). With this list in hand, we set about gathering data for each of the 100 behaviors.
To collect the videos, we built a framework to allow Amazon Mechanical Turk workers to find two-second examples of each of the 100 behaviors within existing YouTube videos, and we built a system for reviewing their submissions, until we had gathered 10,000 acceptable videos clips — 100 for each behavior. We adapted the FFMPEG library to automate the process of trimming and cropping the videos, and to double the speed of each video, reducing it from two seconds to one second, to create a frantic and more abstracted depiction of human life. Each clip is credited by title and author, and viewers can access the underlying videos on YouTube through the Credits section of the website. We paid each worker $.25 for each video collected, costing $2,500 in all.
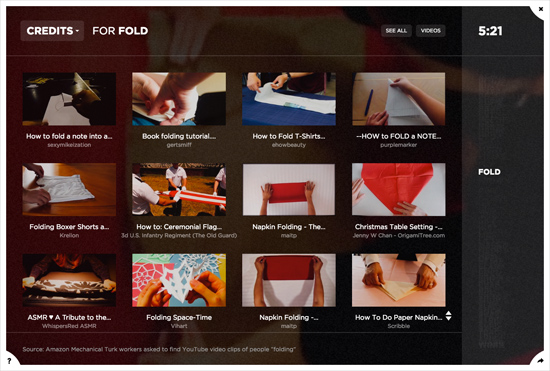
The credits section displays thumbnail images of all 10,000 YouTube video clips that appear in the project, organized by behavior, with each video annotated by title and author. Each thumbnail is hyperlinked to its full original video on YouTube.
To collect the audio, we created a system to query the Twitter API for sentences that mention each of the 100 behaviors, following certain language conventions (e.g. “I swim because...”, “Swimming is…”, etc.). We manually reviewed the resulting sentences, selecting 100 for each behavior. We then created a system to feed these sentences into Amazon Mechanical Turk, asking workers to read them aloud while recording their voice with their cell phone, and then to submit the resulting MP3 files via an HTML form. In this way, we collected 10,000 spoken sentences — 100 for each behavior. We then used our FFMPEG library to merge these sentences into abstracted audio soundscapes, reminiscent of cocktail party chatter (but chatter in which everyone is talking about the same thing). These multilayered sound montages are paired with the videos to create 100 strange and overwhelming audio-visual environments.
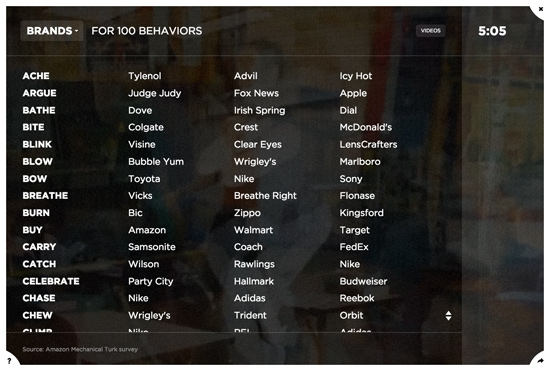
To collect the brands data, we created an Amazon Mechanical Turk survey, asking workers to name the top five brands they would associate with each of the 100 behaviors. We ran this survey 100 times per behavior, discarded brands with less than two guesses, and then took the top ten results based on the number of votes. In the world of technology, this kind of exercise is known as a “Wisdom of the Crowds” survey, in which a large group of non-expert participants are asked to guess a response to a question that would otherwise be difficult to answer. The Wisdom of the Crowds theory posits that such a crowd possesses a kind of collective intelligence, capable of producing answers that are close to the truth.
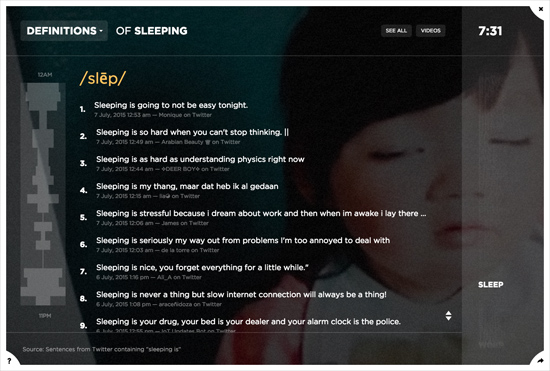
To collect the definitions data, we wrote a system to query the Twitter API for sentences containing each of the 100 behaviors, immediately followed by the word “is” (e.g. “Swimming is…”). In this way, we were able to gather a large and ever-growing corpus of definitions for each behavior, crowdsourced from tweets by thousands of individuals. Based on the local time of each tweet, we were able to create an hourly histogram of definitions, showing, for instance, definitions of drinking offered at 10AM versus 10PM. The definitions data continues to update hourly.
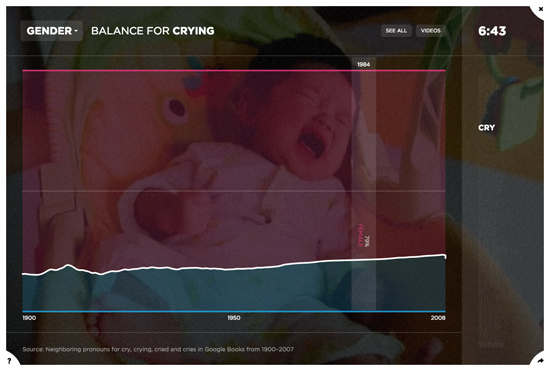
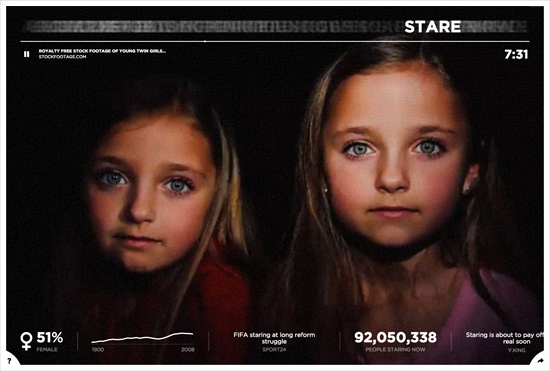
To collect the gender data, we wrote a system to query Google Books Ngrams (a corpus of millions of digitized books — about 6% of all books ever printed) for each of the 100 behaviors from 1900–2008. Each year, we compared the relative prevalence of male pronouns (he, him, his) with female pronouns (she, her, hers) in close proximity to each behavior’s different verb forms (e.g. run, running, ran). In this way, we were able to deduce the gender breakdown for each of the 100 behaviors over the past century. The data communicates the strong female bias of certain activities (e.g. knit, shop, cry) and the strong male bias of others (e.g. shoot, sweat, puke), as well as the various gender shifts occurring over time.
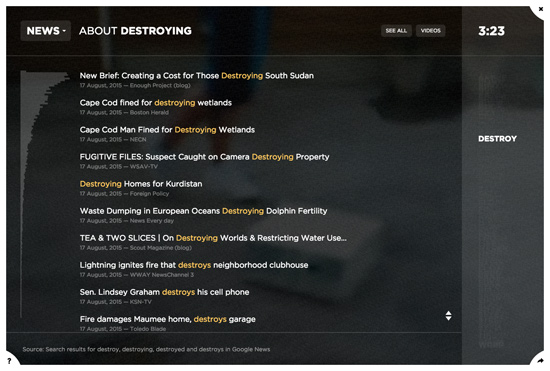
To collect the news data, we wrote a system to crawl Google News for news headlines mentioning any of the 100 behaviors, anytime from January 2004 to the present day. The news stories can be filtered by month and year using an interactive histogram. In this way, we were able to assemble a news archive for human behavior, with strange groupings like news about kissing, pointing, and staring. The news data continues to update hourly.
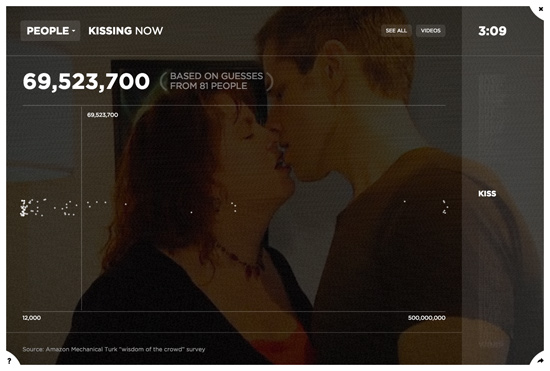
To collect the people data, we created an Amazon Mechanical Turk survey, asking workers to guess how many people in the world were doing each of 100 behaviors right at that moment. We ran this survey 100 times for each behavior, discarded the top and bottom 5% of guesses, and then averaged the rest to arrive at a number. In this way, we were able to venture a reasonable guess at the relative prevalence of each activity in the world at any moment in time, using a method that is, if not scientific, then at least systematic. In the world of technology, this kind of exercise is known as a “Wisdom of the Crowds” survey, in which a large group of non-expert participants are asked to guess a response to a question that would otherwise be difficult to answer. The Wisdom of the Crowds theory posits that such a crowd possesses a kind of collective intelligence, capable of producing answers that are close to the truth.
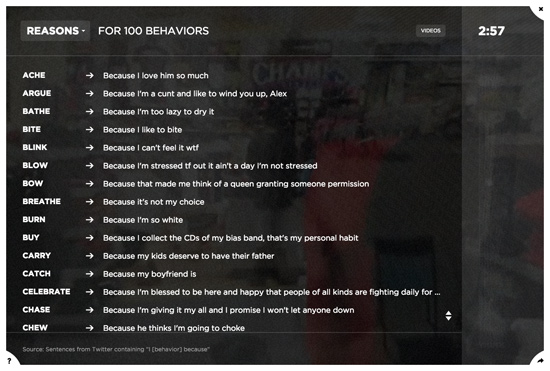
To collect the reasons data, we wrote a system to query the Twitter API for sentences containing each of the 100 behaviors, immediately preceded by the word “I” and immediately followed by the word “because” (e.g. “I swim because...”). In this way, we were able to gather a large and ever-growing corpus of reasons for each behavior, crowdsourced from tweets by millions of individuals. Based on the local time of each tweet, we were able to create an hourly histogram of reasons, showing, for instance, reasons people “touch” at noon versus midnight. The reasons data continues to update hourly.
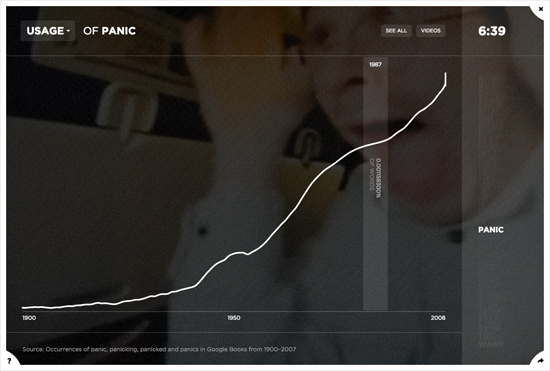
To collect the usage data, we wrote a system to query Google Books Ngrams (a corpus of millions of digitized books — about 6% of all books ever printed) for each of the 100 behaviors from 1900–2008. For each year, we tallied the prevalence of different verb forms for each behavior (e.g. run, running, ran). In this way, we were able to create a kind of historical stock market for human behavior, showing the rise and fall of different activities over the course of a century. The data communicates the overall dominance of giving, the rise of talking, smiling, staring, and panicking, and the decline of crying and writing, among many other trends.
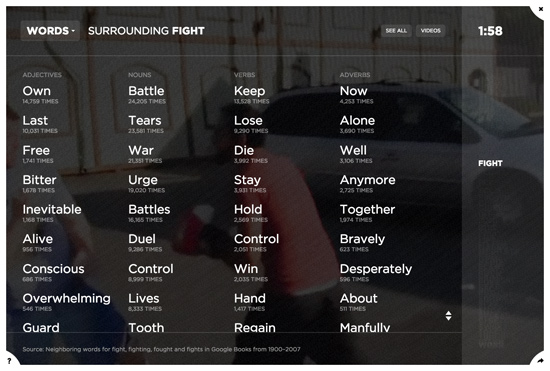
To collect the words data, we wrote a system to query Google Books Ngrams (a corpus of millions of digitized books — about 6% of all books ever printed) for each of the 100 behaviors from 1900–2008, including each behavior's various verb forms (e.g. run, running, ran). For each behavior, we tallied the overall prevalence of different neighboring words, organized by part of speech (i.e nouns, verbs, adjectives, adverbs). In this way, we were able to construct a statistical linguistic landscape for each behavior. For instance, the data communicates that we mainly fight war, battles, urges, and tears, and that the ways in which we fight are often bravely, desperately, manfully, and alone.
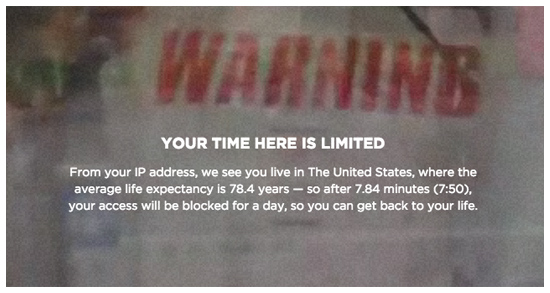
To compute the time limit for each viewer, we wrote a system to approximate their country of origin based on their IP address, and then used a life expectancy database to find the average life expectancy for people living in that particular country. We then translate years to minutes (e.g. 79.5 years = 7.95 minutes = 7:57), to determine how long each viewer will have to explore the project, before being blocked for twenty-four hours. The time limit is intended to induce a feeling of panic and anxiety, consistent with the feeling of Internet culture itself.
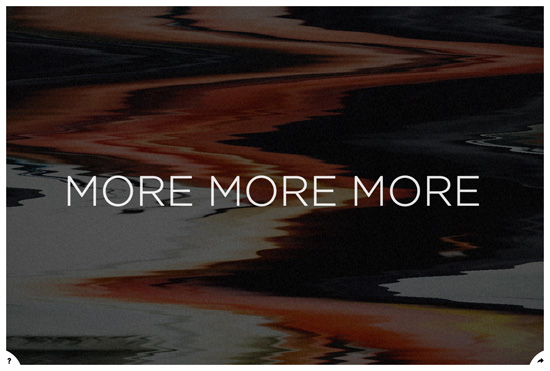
While watching a given behavior’s video clips, if the viewer presses and holds the mouse button, the “Chatter” movement appears, revealing the words, “MORE MORE.” Repeated mouse presses cause additional MOREs to be added to the sequence, eventually overtaking the screen with a potentially infinite number of MOREs.
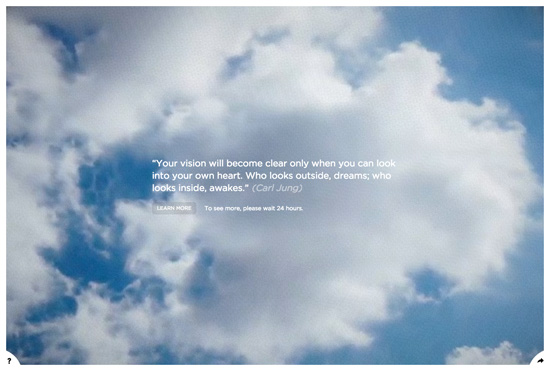
After the viewer’s time is up, the project becomes inaccessible for twenty-four hours, replaced by a short statement by Carl Jung, overlaid on a simple video of clouds from YouTube.
The Network Effect browser icon — the so-called "favicon" — depicts an anonymous avatar, ageless and genderless. It was designed by Lloyd Humphries for The Noun Project and is simply titled, "User."
Here are the numbers behind Network Effect (as of its launch):
| Data points | 4,366,950 |
| From Google News | 4,043,863 |
| From Twitter | 179,103 |
| From Mechanical Turkers | 89,316 |
| YouTube videos collected | 10,000 |
| Tweets recorded aloud | 10,000 |
| Lines of code | 36,760 |
| Data processing | 24,413 |
| Interface | 12,347 |
| Money spent | $3,690 |
| Per video collected | $0.20 |
| Per data point | $0.04 |
Network Effect uses a variety of open-source tools and publicly-available data.
The frontend is written in Javascript (using John Resig’s elegant JQuery) and WebGL (using Ricardo Cabello’s excellent Three.js), with GLSL shader code from Felix Turner, Altered Qualia, and Iñigo Quílez. The font used is Gotham.
The backend is written in Python, with hosting on Google App Engine and Google Cloud Storage. The video and audio handling is done with a homespun adaptation of the excellent FFMPEG library.
The data comes from YouTube, Twitter, Google Books Ngrams, and Google News, with lots of help from Amazon Mechanical Turk to automate many different human tasks. The mapping of IP addresses to countries is provided by Google App Engine, and the life expectancy data is based on a combination of UN and WHO datasets from Wikipedia.
We have an Instagram account showing video mosaics of the 100 different behaviors.
For press purposes, you may download a zip file (11.6 MB) containing assorted images of Network Effect.
You may also email or with specific inquiries.
We're grateful to Julia Kaganskiy and New Inc for providing workspace at the New Museum while we developed this project.
We'd also like to thank Sep Kamvar, Max Schorr, Emily Spivack, Ari Kuschnir, and Ernesto Pujol for their help along the way.
And thank you to the Internet — a miraculous force in this world, full of beautiful potential.